STM32MP1 Browser Performance: Difference between revisions
Fgerstandl (talk | contribs) |
Fgerstandl (talk | contribs) |
||
| Line 48: | Line 48: | ||
== Some Toughts about Javascript performance == | == Some Toughts about Javascript performance == | ||
* Q: Is it correct, that since js is interpreted and is not thread safe, js of a single webpage does not make use of multithreading/multiprocessing? | |||
* A: -JS is interpreted, yes. However, both the chromium v8 engine and firefox tracemonkey are JIT compilers and turn that JS into code native to the architecture on which they are running. This leads to a huge performance boost compared to simple interpreting. The JS JIT compilation can be parallelized. | |||
:- JS is synchronous and has no concept of threads. However, there are these Promise() things and events (like timer callbacks). The JS engines generally have separate thread(s) to deal with such events, so the JS code can set up some "async" operation by calling a function (e.g. load something from somewhere) that triggers a JS function on completion. What happens is that the JS itself runs on CPU0, while a thread doing that loading runs on CPU1, and suddenly your javascript uses two CPU cores. | |||
* Summary: So if you add those two points above together, you get that contemporary JS engines and the way contemporary JS is written end up using multiple CPUs. It is just not done in the traditional manner and it does look like a lot of crutches indeed. | |||
== Profiling with Chrome DevTools == | == Profiling with Chrome DevTools == | ||
Revision as of 16:23, 1 June 2021
Tasks of the GPU
- For „simple“ webpages without 3D-features, the GPU is only used for „blitting“during a process step called „Raster(ization) and Compositing“
- „blitting“ = fast copy and move of memory objects
- By this, a strong relief of the CPU can be achieved
- this should be well possible with the STM32MP1
Performance Tests
"Infragistics Ignite UI" Demo Application

The "Infragistics Ignite UI" is a commercial WebUI framework based on Angular.
To test the browser perfomance a WebUI based on that framework was used.
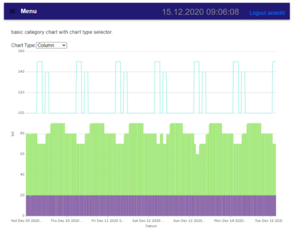
To open the screen in the above screenshot it takes approx. 3 seconds from menu click until content is fully visible
To get some insights the chromium profiling was used.
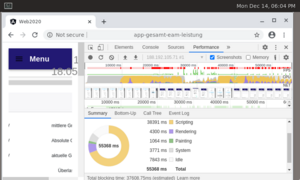 The Chrome Profiler shows following things:
- the CPU does most of the work
- there is no obvious point where CPU cycles would be spent excessively (perf doesn't indicate anything).
- approx. 70% of the time is spent interpreting Javascript. This is also to be expected, since this angular is full of complex Javascript.
- But that also means the slowness is caused by the CPU / website
- not much the GPU can do about this.
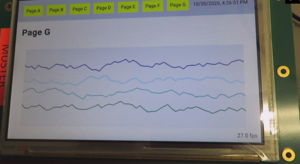
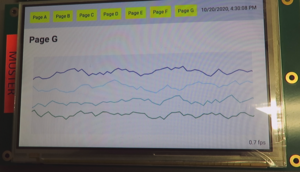
QOpenGLWidget Example
Line-Chart Demo Application
with GPU
https://www.dropbox.com/s/323nv90lhp9wh02/mit_GPU.MP4?dl=0
no GPU
https://www.dropbox.com/s/kprvgowf8kzod6a/ohne_GPU.MP4?dl=0
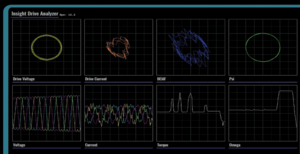
DH demo from tradeshow
Webgl example (aquarium)
Functional GPU testing
Some Toughts about Javascript performance
- Q: Is it correct, that since js is interpreted and is not thread safe, js of a single webpage does not make use of multithreading/multiprocessing?
- A: -JS is interpreted, yes. However, both the chromium v8 engine and firefox tracemonkey are JIT compilers and turn that JS into code native to the architecture on which they are running. This leads to a huge performance boost compared to simple interpreting. The JS JIT compilation can be parallelized.
- - JS is synchronous and has no concept of threads. However, there are these Promise() things and events (like timer callbacks). The JS engines generally have separate thread(s) to deal with such events, so the JS code can set up some "async" operation by calling a function (e.g. load something from somewhere) that triggers a JS function on completion. What happens is that the JS itself runs on CPU0, while a thread doing that loading runs on CPU1, and suddenly your javascript uses two CPU cores.
- Summary: So if you add those two points above together, you get that contemporary JS engines and the way contemporary JS is written end up using multiple CPUs. It is just not done in the traditional manner and it does look like a lot of crutches indeed.
Profiling with Chrome DevTools
Chrome DevTools is a set of web developer tools built directly into the Google Chrome browser. It is possible to analyse the runtime performance of a website directly on the target or remote with an PC connected over ethernet. With an remote connection you can measure the performance without interfering the measurment itself. The Chrome DevTools can also be used with an qtWebengine.
How to use Chrome DevTools with an remote connection
To be able to remote debug chromium on the target you need to start the chromium or qWebengine with the following parameters:
-remote-debugging-port=9222 --user-data-dir=remote-profile
To access it from a different computer you need to forward the port with ssh:
ssh -L 0.0.0.0:9223:localhost:9222 localhost -N
This must be done before the webbrowser gets started.
With an Chrome Browser on an computer connected with the target over ethernet you can now open the devtools with the IP of the target and the port "9223".
This clip shows you how to open den chrome devtools within chrome: devtools-open.mp4
DevTools analysis
The following tools can be used for performance anlaysis:
- CPU Usage:

- devtools-performance-monitor-cpu.mp4
- With this stat you can easily see when the CPU is under full load.
- GPU Usage:

- The graph shows when the GPU is under use. But it does not show the GPU load in percent.
- It is a useful tool to see if the GPU is fully ocupied.
- If the GPU is disabled (software rendering) this graph is absent.
- Frame Rendering Stats:
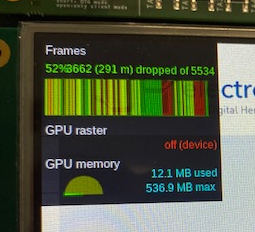
- Newer chrome versions don't show live FPS anymore. But you can us "dropped" or "delayed" frames as indicator for good or bad performance. The higher the percentage value (frames rendered in time) the better.
- A good explanation can be found here:
- https://groups.google.com/a/chromium.org/g/blink-dev/c/iHULoSyUxOQ
- Performance Profile:
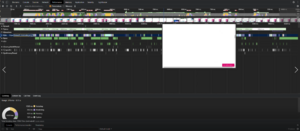
- devtools-start-performance-profiling.mp4
- The performance profile gives you an overview over all important stats at once. You can record it while browsing through an website on the target.
- You can save such profiles and import it with any other chrome browser to analyse the profile offline.
Brief summary
- Webapplications must be optimized for particular embedded system resp. SOC
- Comprehensive analysis and profiling tools are available
- Thus, appealing web pages on embedded systems should be possible
- … where also the “responsiveness" is given
