Debugging M4 on STM32MP15xxxx
For general information about the STM32MP15xxxx pleas refer to the official Wiki. This page describes various ways to debug the M4 on STM32MP15xxxx from ST.
Debugging modes
Production mode and Engineering mode are described here in the ST Wiki. To enter Engineering mode with the Avenger96 read the chapter "Boot Mode" in the Getting started guide and look for "NoBoot".
Debugging with STM32CubeIDE
Debugging for both modes is also described in the ST wiki here.
Without console or lan connection
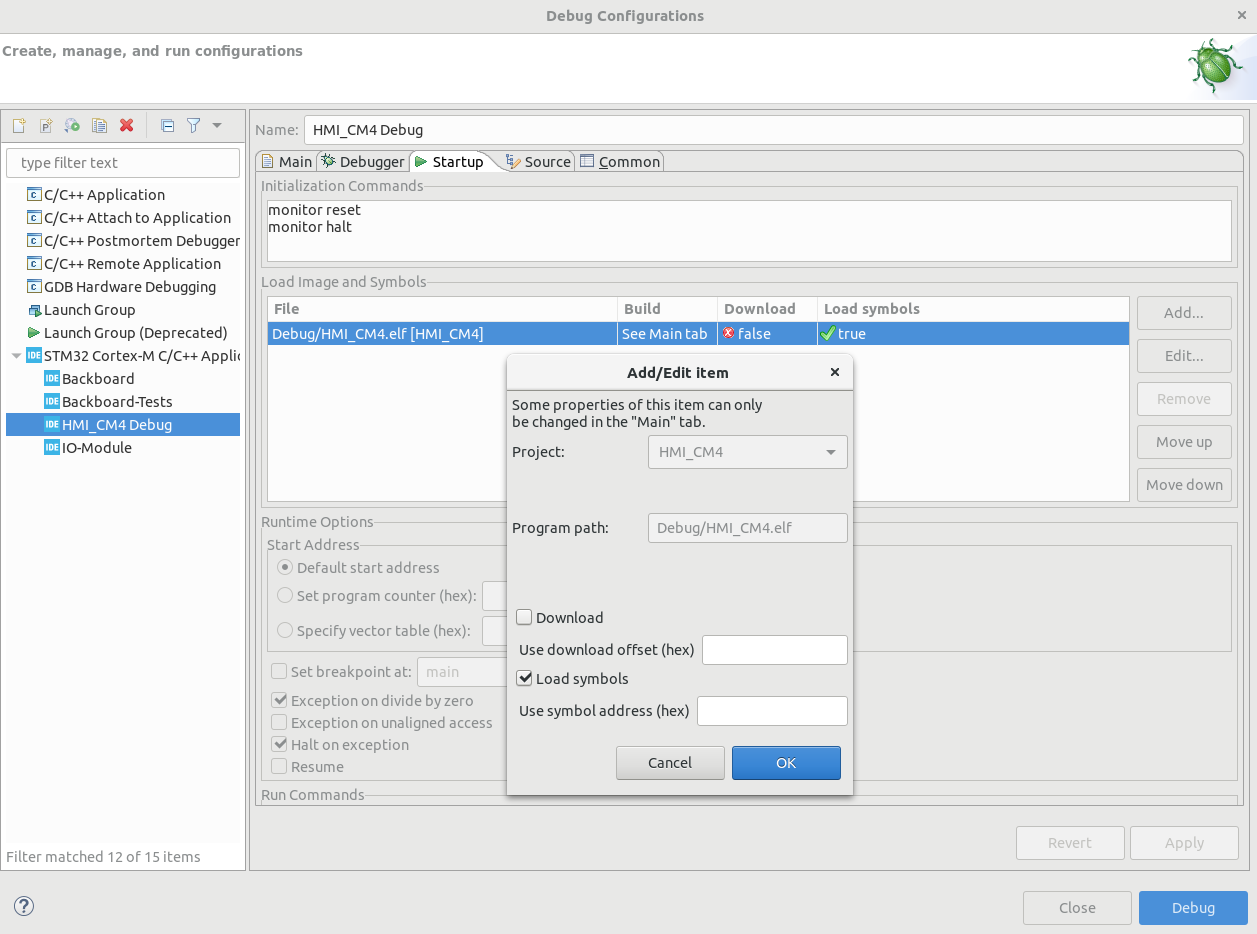
If you have no console or lan connection STM32CubeIDE don't let you start the debugging session. In this case it is possible to manually start th M4 on the target and start the debugging session with "thruJTAG/SWD (Engineering mode)". Therefor go to:
- Debug Configuration
- Then to the Startup tab
- Doppleclick your .elf file in "Load Image and Symbols"
- Uncheck "Download"
Debugging with GDB (without IDE)
https://wiki.st.com/stm32mpu/wiki/GDB#Debug_Cortex-M4_firmware_with_GDB
Debugging with trace output on Linux
https://wiki.st.com/stm32mpu/wiki/STM32CubeMP1_Package#Logging_in_production_mode
