Debugging M4 on STM32MP15xxxx
For general information about the STM32MP15xxxx please refer to the official Wiki. This page describes ways to debug the M4 on STM32MP15xxxx from ST.
Debugging modes
Production mode and Engineering mode are described here in the ST Wiki. To enter Engineering mode with the Avenger96 read the chapter "Boot Mode" in the Getting started guide and look for "NoBoot".
Debugging with STM32CubeIDE
Debugging for both modes is also described in the ST wiki here. If you have problems debugging in Production mode, see next subcaption.
Without console or lan connection
If you have no console or lan connection, STM32CubeIDE does not let you start the debugging session in Production mode. In this case it is possible to manually start the M4 on the target and start the debugging session with "thruJTAG/SWD (Engineering mode)".
1. Manually start the M4
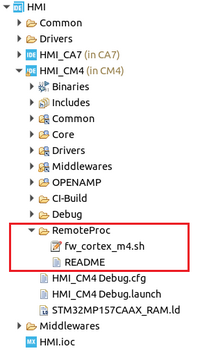
Therefore copy your elf file and the fw_cortex_m4.sh script to the same folder in Linux running on the A7.
You can find fw_cortex_m4.sh in the M4 project of STM32CubeIDE, see picture below.
Next start the M4 with ./fw_cortex_m4.sh start.
To stop the M4 run ./fw_cortex_m4.sh stop.
2. Debug the manually started M4
Therefor navigate in the STM32CubeIDE to:
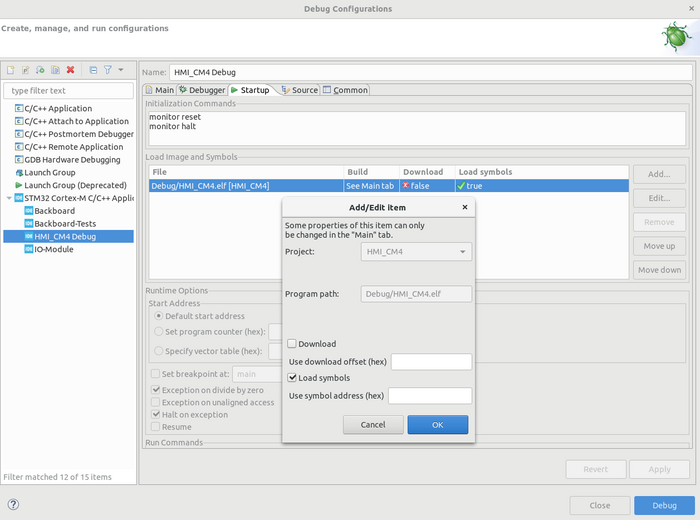
- Debug Configuration and choose "thruJTAG/SWD (Engineering mode)" in the Debugger tab
- Then go to the Startup tab
- Double click your elf file in "Load Image and Symbols"
- Uncheck "Download"
- Then in "Initialization Commands" remove "monitor reset" and "monitor halt"
- Now you can click the blue Debug button
- The M4 will be running (not stoped at main()), therefor you have to set a break point or click the pause button to stop the M4. From there you can single step like normal
Debugging with GDB (without IDE)
https://wiki.st.com/stm32mpu/wiki/GDB#Debug_Cortex-M4_firmware_with_GDB
Debugging with trace output on Linux
https://wiki.st.com/stm32mpu/wiki/STM32CubeMP1_Package#Logging_in_production_mode

