STM32MP1 Browser Performance: Difference between revisions
From Wiki-DB
Jump to navigationJump to search
Fgerstandl (talk | contribs) |
Fgerstandl (talk | contribs) |
||
| Line 7: | Line 7: | ||
== Performance Tests == | == Performance Tests == | ||
=== "Infragistics Ignite UI" Demo Application === | === "Infragistics Ignite UI" Demo Application === | ||
[[File:Infragistics.png|frameless]] | [[File:Infragistics.png|frameless]]<br> | ||
The "Infragistics Ignite UI" is a commercial WebUI framework based on Angular. <br> | The "Infragistics Ignite UI" is a commercial WebUI framework based on Angular. <br> | ||
It has many web controls for many purposes and was used for an performance test. | It has many web controls for many purposes and was used for an performance test. | ||
[[File:BardiagramIgnite.png|frameless]] | [[File:BardiagramIgnite.png|frameless]]<br> | ||
To open the screen in the above screenshot it takes approx. 3 seconds from menu click until content is fully visible | To open the screen in the above screenshot it takes approx. 3 seconds from menu click until content is fully visible | ||
[[File:ChromeProfilingIgnite.png|thumb]] | |||
The Chrome Profiler shows the following: | |||
* the CPU does most of the work | |||
* there is no obvious point where CPU cycles would�be spent excessively (perf doesn't indicate anything). | |||
* approx. 70% of the time is spent interpreting Javascript. This is also to be expected, since this angular is full of complex Javascript. | |||
* But that also means the slowness is caused by the�CPU / website | |||
* not much the GPU can do about this. | |||
=== QOpenGLWidget Example === | === QOpenGLWidget Example === | ||
Revision as of 12:27, 1 June 2021
Tasks of the GPU
- For „simple“ webpages without 3D-features, the GPU is only used for „blitting“during a process step called „Raster(ization) and Compositing“
- „blitting“ = fast copy and move of memory objects
- By this, a strong relief of the CPU can be achieved
- this should be well possible with the STM32MP1
Performance Tests
"Infragistics Ignite UI" Demo Application
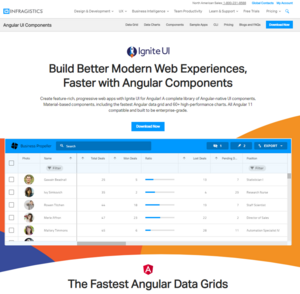
The "Infragistics Ignite UI" is a commercial WebUI framework based on Angular.
It has many web controls for many purposes and was used for an performance test.
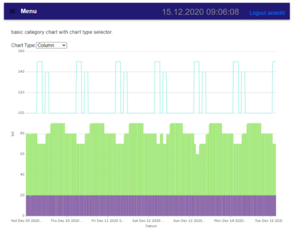
To open the screen in the above screenshot it takes approx. 3 seconds from menu click until content is fully visible
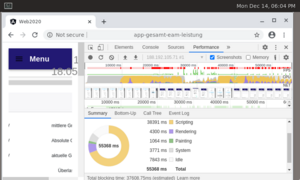
The Chrome Profiler shows the following:
- the CPU does most of the work
- there is no obvious point where CPU cycles would�be spent excessively (perf doesn't indicate anything).
- approx. 70% of the time is spent interpreting Javascript. This is also to be expected, since this angular is full of complex Javascript.
- But that also means the slowness is caused by the�CPU / website
- not much the GPU can do about this.
QOpenGLWidget Example
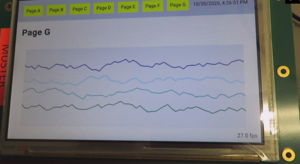
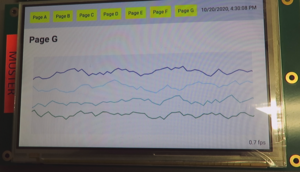
Line-Chart Demo Application
with GPU
https://www.dropbox.com/s/323nv90lhp9wh02/mit_GPU.MP4?dl=0
no GPU
https://www.dropbox.com/s/kprvgowf8kzod6a/ohne_GPU.MP4?dl=0
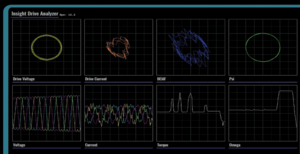
DH demo from tradeshow
Webgl example (aquarium)
Functional GPU testing
Some Toughts about Javascript performance
Profiling with Chromium
Brief summary
- Webapplications must be optimized for particular embedded system resp. SOC
- Comprehensive analysis and profiling tools are available
- Thus, appealing web pages on embedded systems should be possible
- … where also the “responsiveness" is given
